
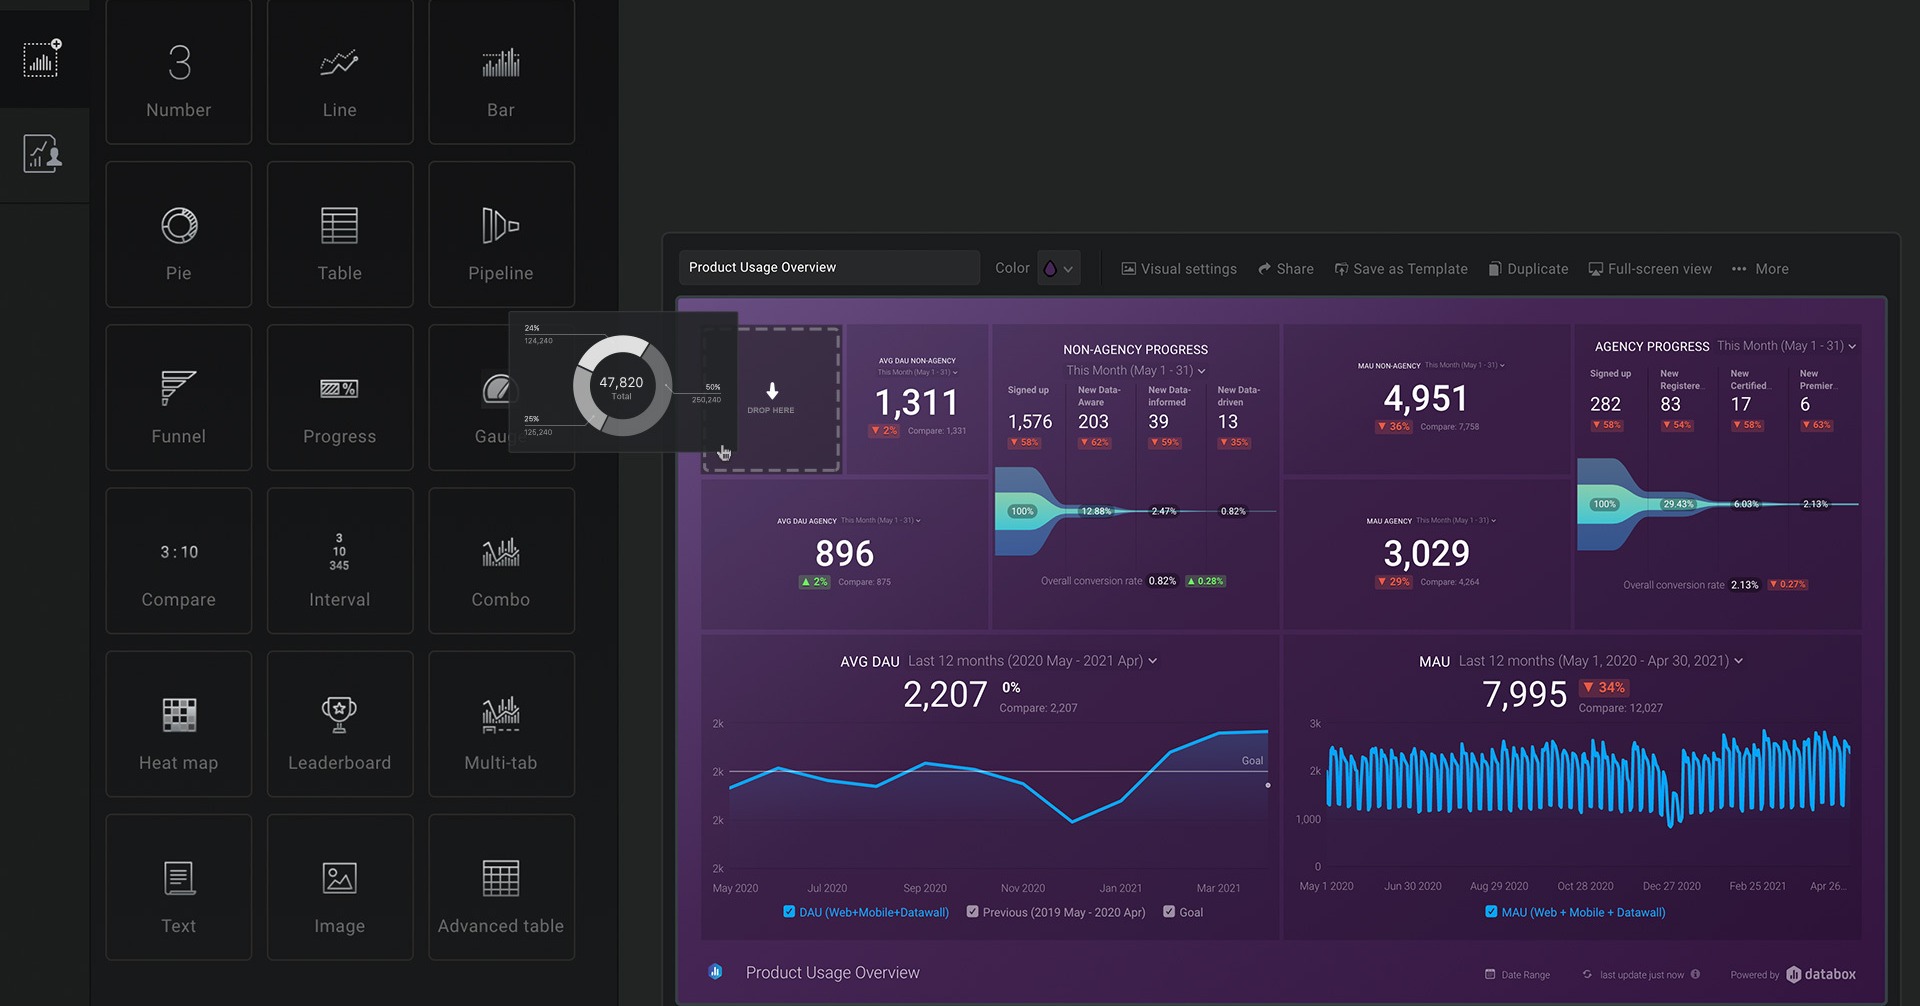
What if you had all your business performance data in one place so you could track your progress, measure your goals, and more, all on the same platform? Think of the time this could save you and how much more streamlined your business can be. This is where Databox comes in. Databox allows you to build custom dashboards and track your performance by connecting your data from any tool and tracking it from any device.
Keep It Simple
When it comes to tracking metrics, goals, and performance it can become overwhelming and complicated with the amount of data there is. If you can keep it simple by using an all-in-one system, it will make your life easier and your team’s life easier. Instead of visualizing data from numerous spreadsheets, you can use Databox to see it all in one place and only pull the metrics you actually need into it.
Additionally, Databox is easy to set up. To begin, you’ll first select a dashboard template such as marketing, sales, customer support, or e-commerce. Then, you simply connect the data sources to Databox, and the data will populate. Once your Databox dashboard is set up, you will notice how much more it is than just a dashboard.
More Than A Dashboard
Using a tool like Databox allows you to more easily plan ahead by setting up benchmarks and goals for the year, the quarter, and each month. You can also have a better plan for the week since you can easily monitor your performance daily. How does Databox help you accomplish this?
1. TV Dashboards: Share metrics to your entire organization
Monitor and report your company’s performance in one place and give access to anyone who needs it. No more pulling multiple reports and sending each specific report to a specific individual. Anyone you give access to can see what they need in one location.
2. Scorecards: Get daily, weekly or monthly performance updates sent to you
Scorecards allow your team to be sent a KPI report whenever needed. Instead of everyone pulling their own report together, scorecards do it for you and can be automatically sent out to everyone on the team.
3. Notifications: Be alerted when metrics are trending up, down, or on track
Performance alerts can be sent to you on a daily, weekly, or monthly basis. Rather than being late to a trend in your performance, you and your team can be alerted immediately to the good and what may need improvement.
4. Calculated Metrics: Calculate metrics, conversion rates, and ROI from multiple sources without a spreadsheet
We have all seen one too many spreadsheets and there is finally a way to see your data in a compact, visually appealing way. Metrics from multiple sources such as payment providers and different engagement tracking websites can now be automatically pulled into a single report.
5. Goals: Set goals and see your progress in real-time
Goal tracking is incredibly important as it helps to make performance more predictable that allows you to better plan ahead. With Databox you can see your goals versus your actual performance so you can make any adjustments needed to ensure you hit your future goals. Using the goal function you can set realistic goals, assign goals to individuals, set goals for the future, and store your goal history.
Tools like Databox help avoid human error and make goals and decisions based on real-time data. It gives a real perspective into what’s happening at your company and allows you to be more efficient. If you’re ready to improve your business's performance and streamline your goals, schedule a call with Revv Partners today.